

Freight delivery company Landstar (NASDAQ:LSTR) beat Wall Street’s revenue expectations in Q1 CY2025, but sales fell by 1.9% year on year to $1.15 billion. Its GAAP profit of $0.85 per share was 5.7% below analysts’ consensus estimates.
Is now the time to buy Landstar? Find out by accessing our full research report, it’s free.
Landstar (LSTR) Q1 CY2025 Highlights:
- Revenue: $1.15 billion vs analyst estimates of $1.14 billion (1.9% year-on-year decline, 1% beat)
- EPS (GAAP): $0.85 vs analyst expectations of $0.90 (5.7% miss)
- Adjusted EBITDA: $51.65 million vs analyst estimates of $56.99 million (4.5% margin, 9.4% miss)
- No forward guidance given in the earnings release
- Operating Margin: 3.4%, down from 5.1% in the same quarter last year
- Market Capitalization: $5.03 billion
JACKSONVILLE, Fla., May 13, 2025 (GLOBE NEWSWIRE) -- Landstar System, Inc. (NASDAQ: LSTR) (“Landstar” or the “Company”) today reported basic and diluted earnings per share (“EPS”) of $0.85 in the 2025 first quarter on revenue of $1.153 billion.
Company Overview
Covering billions of miles throughout North America, Landstar (NASDAQ:LSTR) is a transportation company specializing in freight and last-mile delivery services.
Sales Growth
Examining a company’s long-term performance can provide clues about its quality. Any business can put up a good quarter or two, but the best consistently grow over the long haul. Regrettably, Landstar’s sales grew at a sluggish 3.8% compounded annual growth rate over the last five years. This was below our standard for the industrials sector and is a rough starting point for our analysis.
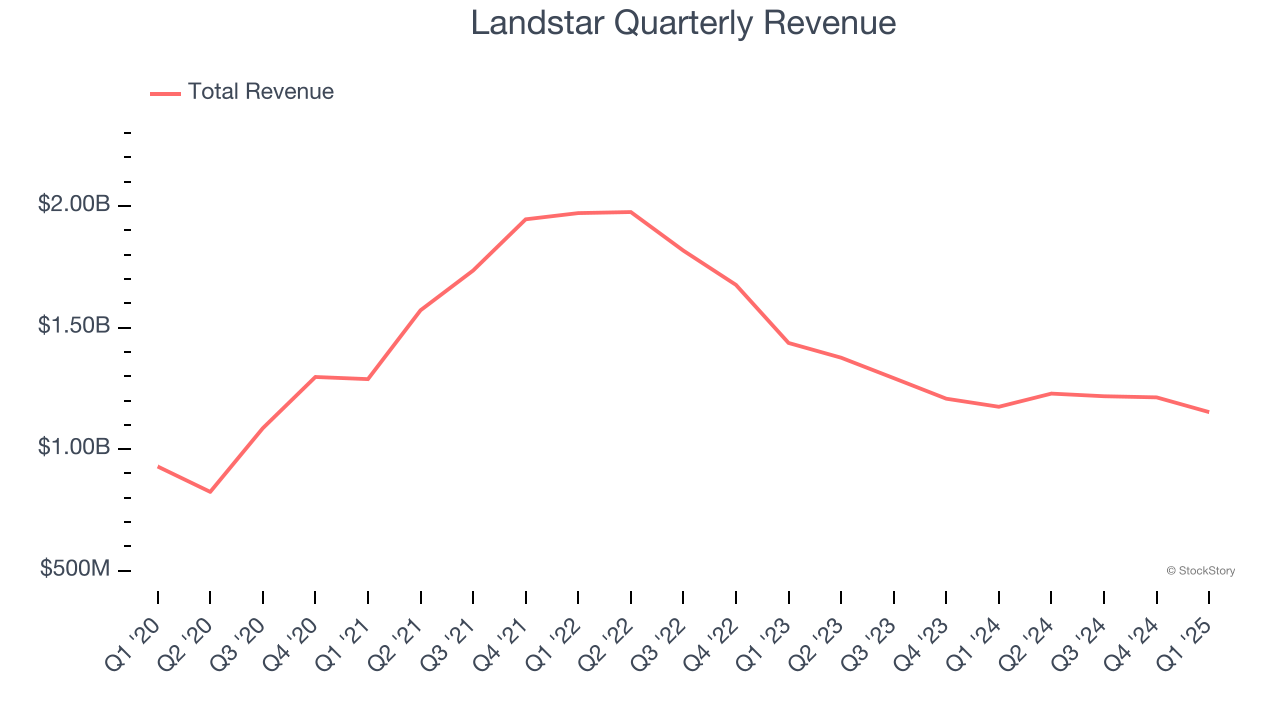
We at StockStory place the most emphasis on long-term growth, but within industrials, a half-decade historical view may miss cycles, industry trends, or a company capitalizing on catalysts such as a new contract win or a successful product line. Landstar’s performance shows it grew in the past but relinquished its gains over the last two years, as its revenue fell by 16.5% annually. Landstar isn’t alone in its struggles as the Ground Transportation industry experienced a cyclical downturn, with many similar businesses observing lower sales at this time. 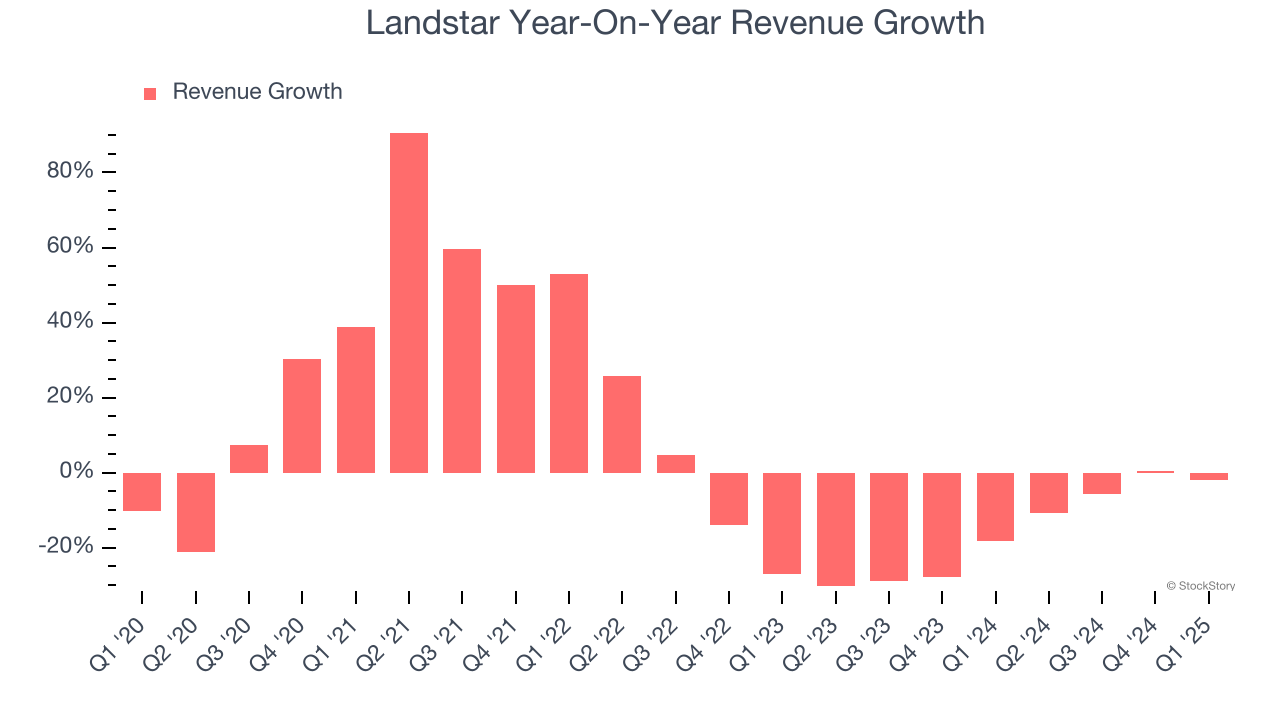
We can dig further into the company’s revenue dynamics by analyzing its most important segments, Van Equipment and Platform Equipment, which are 51.6% and 29.5% of revenue. Over the last two years, Landstar’s Van Equipment revenue (full truckload van transportation) averaged 16.8% year-on-year declines while its Platform Equipment revenue (full truckload trailer transportation) averaged 7.8% declines.
This quarter, Landstar’s revenue fell by 1.9% year on year to $1.15 billion but beat Wall Street’s estimates by 1%.
Looking ahead, sell-side analysts expect revenue to grow 5.1% over the next 12 months. Although this projection implies its newer products and services will spur better top-line performance, it is still below average for the sector.
Today’s young investors won’t have read the timeless lessons in Gorilla Game: Picking Winners In High Technology because it was written more than 20 years ago when Microsoft and Apple were first establishing their supremacy. But if we apply the same principles, then enterprise software stocks leveraging their own generative AI capabilities may well be the Gorillas of the future. So, in that spirit, we are excited to present our Special Free Report on a profitable, fast-growing enterprise software stock that is already riding the automation wave and looking to catch the generative AI next.
Operating Margin
Operating margin is an important measure of profitability as it shows the portion of revenue left after accounting for all core expenses – everything from the cost of goods sold to advertising and wages. It’s also useful for comparing profitability across companies with different levels of debt and tax rates because it excludes interest and taxes.
Landstar was profitable over the last five years but held back by its large cost base. Its average operating margin of 6.7% was weak for an industrials business. This result isn’t too surprising given its low gross margin as a starting point.
Looking at the trend in its profitability, Landstar’s operating margin decreased by 2 percentage points over the last five years. This raises questions about the company’s expense base because its revenue growth should have given it leverage on its fixed costs, resulting in better economies of scale and profitability. Landstar’s performance was poor no matter how you look at it - it shows that costs were rising and it couldn’t pass them onto its customers.
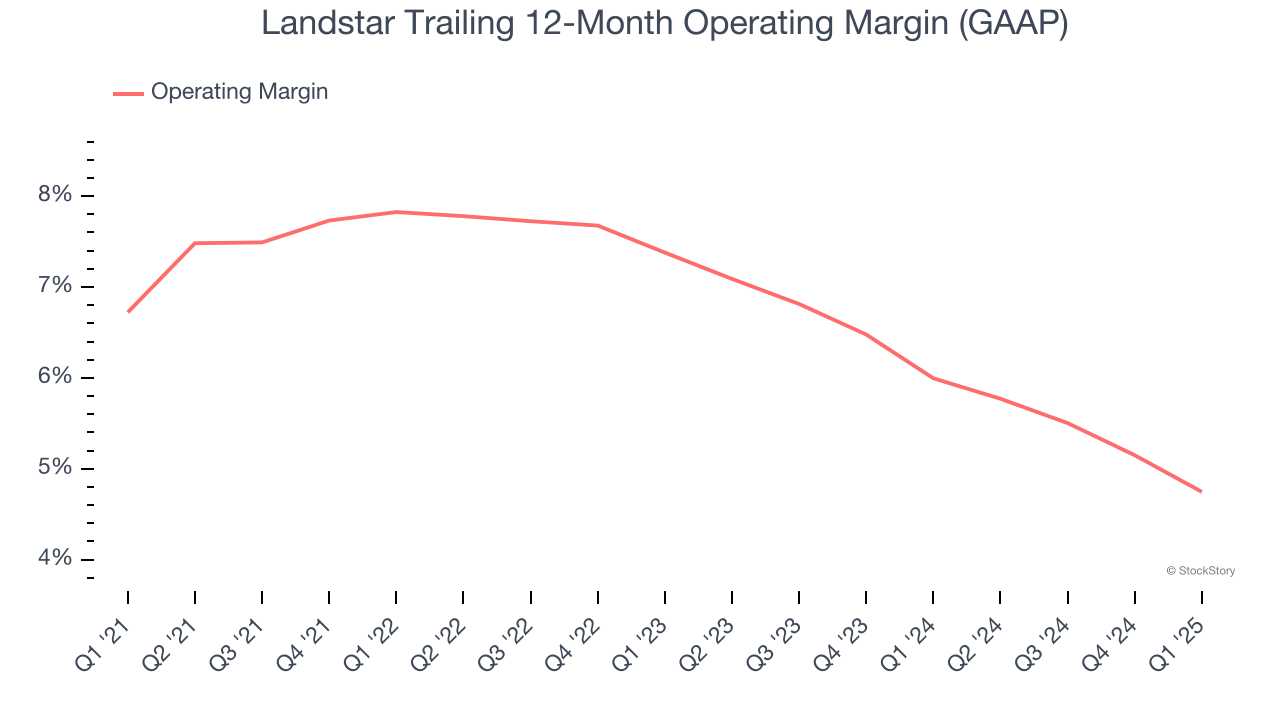
This quarter, Landstar generated an operating profit margin of 3.4%, down 1.7 percentage points year on year. Since Landstar’s gross margin decreased more than its operating margin, we can assume its recent inefficiencies were driven more by weaker leverage on its cost of sales rather than increased marketing, R&D, and administrative overhead expenses.
Earnings Per Share
Revenue trends explain a company’s historical growth, but the long-term change in earnings per share (EPS) points to the profitability of that growth – for example, a company could inflate its sales through excessive spending on advertising and promotions.
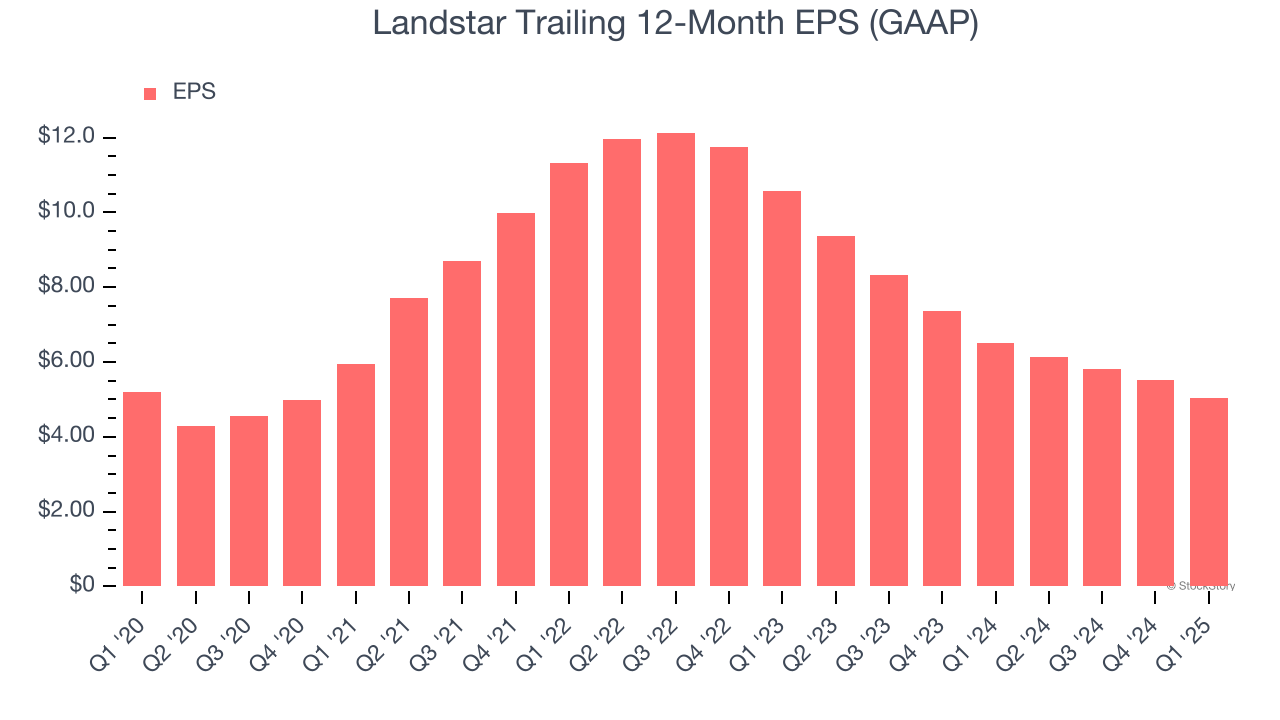
Landstar’s flat EPS over the last five years was below its 3.8% annualized revenue growth. This tells us the company became less profitable on a per-share basis as it expanded due to non-fundamental factors such as interest expenses and taxes.
Diving into the nuances of Landstar’s earnings can give us a better understanding of its performance. As we mentioned earlier, Landstar’s operating margin declined by 2 percentage points over the last five years. This was the most relevant factor (aside from the revenue impact) behind its lower earnings; taxes and interest expenses can also affect EPS but don’t tell us as much about a company’s fundamentals.
Like with revenue, we analyze EPS over a more recent period because it can provide insight into an emerging theme or development for the business.
For Landstar, its two-year annual EPS declines of 30.9% show its recent history was to blame for its underperformance over the last five years. These results were bad no matter how you slice the data.
In Q1, Landstar reported EPS at $0.85, down from $1.32 in the same quarter last year. This print missed analysts’ estimates. Over the next 12 months, Wall Street expects Landstar’s full-year EPS of $5.05 to grow 15.9%.
Key Takeaways from Landstar’s Q1 Results
It was good to see Landstar narrowly top analysts’ revenue expectations this quarter. We were also glad its Van Equipment revenue topped Wall Street’s estimates. On the other hand, its EBITDA missed significantly and its EPS fell short of Wall Street’s estimates. Overall, this was a softer quarter. The stock traded down 2.9% to $139.59 immediately following the results.
Landstar underperformed this quarter, but does that create an opportunity to invest right now? The latest quarter does matter, but not nearly as much as longer-term fundamentals and valuation, when deciding if the stock is a buy. We cover that in our actionable full research report which you can read here, it’s free.